
 Tracking your website traffic and engagement is going to give you an insight into how it’s performing: so you can make informed decisions based on the data. You’ll then be able to tweak your marketing campaigns to drive traffic to another page, assess what’s not working well and why, as well as see what is working.
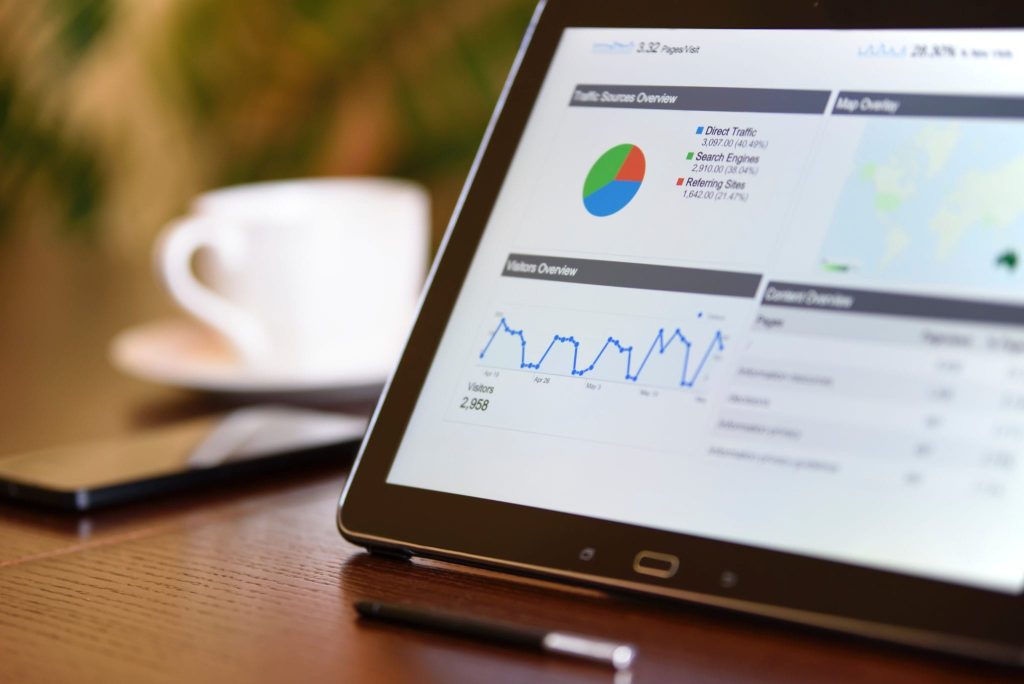
You’ll have heard of Google Analytics, it’s the most popular and powerful analytics tool available, and it will give you insight on everything on your website. There’s a lot of information on there, different reports you can run and review: which can be overwhelming.
It’s more than likely you’ll already have Google Analytics set up (either by yourself or when your website was built) but want to know how best to use it before just pulling out numbers.
If you’ve opened it up before and thought “where do I start?”, “Which information is the most useful?”, or “what does that mean?” you’re not alone. But once you grasp the basics you’ll soon work your way through it.
A good way to start is to ask yourself (and your team) what information you want to find out, such as:
- Which website pages are the most popular? This will give you a guide to what your visitors are interested in, what content is working and not working based on the data.
- How many people visit my website? This will show your reach, if you’re driving people to go to your website, you’ll see how many are actually going.
- Where does the traffic come from – campaigns, social media? This will give you an indicator of how your social and campaigns are performing to get people to your website.
- Which blogs are the most popular? This gives a view into which content is attracting people, but bear in mind that SEO plays a heavy part in this. So if you’ve got your blog post set up well, and people are searching for content on that topic your post will hopefully be in the search results.
- What country do the visitors come from? If you’re focusing on a specific area you’ll be interested to see where your visitors are coming from. You may even spot some new opportunities, or get ideas around content that would be even more tailored to location.
You’ll then have some clear sections to focus on within the tool to find those answers: but you’ll pick everything up much quicker when you understand what each report provides.
Guide to the reports in Google Analytics:
When you first open the tool you’ll arrive on the homepage, which can look different depending how you customise it. All of the standard reports are then listed down the left hand side of the main dashboard (Real-time, Audience, Acquisition, Behaviour and Conversions).
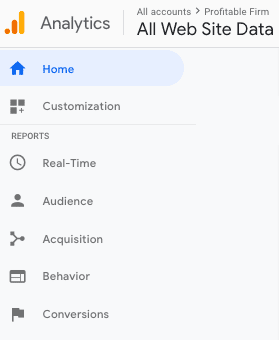
As i’ve said there’s a HUGE amount of information available, so i’m just going to share a general overview of what each section is so you have that knowledge and know some of the key areas of the reports that can help your firm.
Some tips to keep in mind before reading the reports:
- Report dates: Each report will show data based on the past 7 days, but you can view any date range (I tend to do per month). To change the range just go to the top right hand corner of the page and either select the dates, or chose hour, day, week or month.
- Data comparison: You can also compare this data against a previous time, just tick the ‘compare to’ option and enter the comparison date.
- Extra detail: Each of the charts within the reports are interactive too. Just hover over the section which interests you and you’ll get a break down of the data.
- Title explanation: If you’re wondering what one of the sections within the reports mean then just hover over the text and you’ll get a pop up explanation.
- Your questions: Keep these in mind as you make your way through it all. It’s going to clarify what you’re looking for, and at.
- Additional, in-depth data: Keep in mind that some of the really in-depth data (like the gender, or interests) is based on pre-set goals you link up between your website and Google Analytics. To be honest this is something to focus on after the basics.
Real-time reports
As the name says, you get real time information based on the people on your website then and within the last 5 minutes.
The report shows how many users are currently active on your site, a list of the top active pages, top sources of referral traffic, top social media traffic, and top locations that users are visiting from right then.
If you’re running a campaign and want to test it’s working, especially if you have a tracking link then this report will help. You’ll see the results right away, and be able to spot if there’s anything wrong.
I don’t use this report too much as i think you get a better picture of what’s happening over a bigger time range. However it is really interesting to see what’s happening then and there if you’re running an offer on your business review services, or just launched a new blog which shares MTD tips.
Audience reports
This report give you the low down on your visitors! Keep in mind that the profile information isn’t 100% accurate, it’s more of a guide.
You can find out where people are visiting from (it’s amazing seeing the map with all the locations marked), the language they speak, how often they visit your website, whether they use desktop or mobile to view the website. You can look at really in-depth data like the visitors gender, age and interests if you’ve set up campaigns and goals which collect this data.
There’s also an ‘active users’ section within this report which shows the number of unique visitors that have been on the site. This is handy to look at while you have a campaign running that points people to your website.
‘Geo’ reports are useful if you’re running social media ads and want to check what locations (right down to city) to hone in on. It’s also handy for spotting potential business opportunities you may be missing.
Acquisition reports
Wondering where your traffic is coming from? This is where you find out!
You can view all your visitors by going to the ‘All traffic’ section, within acquisitions. The traffic is then split right down channels, source/medium and referrals. This is brilliant for looking at which content is working, not working and to then adapt. You can drill even further down to specific blogs, pages or social media platforms.
Then right into the number of visitors per content piece or page. Combine this with your social stats and you’ll start to get a great picture of what’s happening.
Behaviour reports
Within the behaviour reports you’ll get all the juicy news about your content: just look at the ‘site content’ section. You’ll see the numbers on all the top pages on your website, the pages people enter the site at, as well as the pages that the leave from.
There’s some great little tools in here too within the site speed section which can guide you on how to make your website faster.
Use these reports to get an idea of your overall traffic, see which pages are performing best and compare month on month.
Conversion reports
As I mentioned you can set up goals within the tool, these can link into your campaigns so you can track the journey your visitors take. Then assess how they are converting. This can link into any Facebook Ads you’re running too, and you’ll see where people go once they’ve clicked the Ad, and then see if they’ve visited the landing page you provided.
There’s so much you can do, but take a look at the reports that fit your questions and build up your experience of using the tool.
How do I check if I already have a Google Analytics account set up?
To use Google Analytics it needs to be installed on your website. A lot of people have this done when their website is built. (If PF is building your website now, we’ll do this for you automatically: but you’re welcome to confirm this, if you’re not sure!)
If you’re not sure if you have an account you need to sign in to your Google Account (you need this before you can have a Google Analytics account). Once done, then go to the Google Analytics webpage and click sign in. Then click ‘analytics’ from the drop down menu.
A new page then opens which asks you to enter your Google Account email and password. If you already have a Google Analytics account set up it will then open up. If you don’t you’ll get a message asking you to sign up.
How do I check if someone else has a Google Analytics account linked to my website?
If you want to know if anyone else has installed Google Analytics under another account you need to check through your website.
- Open one of your website pages in Google Chrome
- Right-click the page, then click View page source.
- You’ll see a lot of code. Search through for “UA-“.
If that codes there then someone has an account and can access the data so it’s worth trying to find out who it could be. If it’s not then there’s no linked Google Analytics account.
Keep focusing on quality content to drive good results
The key to a high performing website is making sure it’s relevant to your target audience, and all of the content you’re sharing is for them: whether it’s the email campaigns or social that push them to visit the website. They’ll only visit, or stay to interact with the pages if what’s on there interests them.
SEO plays a big role too, especially in helping people to find your content that don’t already know you so keep that in mind when you’re adding anything new to your website pages. This is all something you can focus on over time, and Google Analytics will help you monitor your progress.
Google Analytics is a beast, and I could write forever on the different options. To keep it simple, i’ll share in another blog a break down of all the terms used within each report. Keep an eye out for it soon.