


When you track your firm’s social media activity you’ll begin to hone in on what content is helping you attract the right audience, and what’s not.
You’ll be able to make tweaks along the way to help you get to a place where you’re sharing content that people engage with.
But it’s a fine balance when deciding what to actually track – and how.
The best way to do get to grips with your tracking is to jump in, test it out and take your time: that’s how we learn.
Accountants often ask us if there’s a free one-stop social media analytics tool: and the simple answer is no.
However, you can pay to get a huge range of analytics through tools like Sendible, and it’ll be displayed in a report per social platform you have connected. The majority of the analytics in there can be found for free within each platform: you’ll just need to create your own report.
What part of my social media activity do I focus on tracking first?
Everyone wants to rush to the lead generation stage: the ads! But take a step back. To run successful ads on any platform you first need to have a consistent presence on your chosen platform and be building trust through your content.
CH Accountancy, Raedan and Fresh Financials are a few firms who do this well.
If you’re already there, and ready for the next stage then take a look at this blog on tracking your social media lead gen.
If you’re still building your content so you can have great ads later, take a look at each of the platforms below, where we’ve listed the top things to look at first.
These things will give you the clearest view. You can go further, but only dig as deep as you need to.
Twitter analytics to track
Let’s look at Twitter and some of the key areas to track! The direct analytics are fantastic and easy to understand.
To view your Twitter analytics:
- Log into your Twitter account
- Go to https://analytics.twitter.com/
You’ll see all your firm’s stats in a dashboard, broken down by day and month.
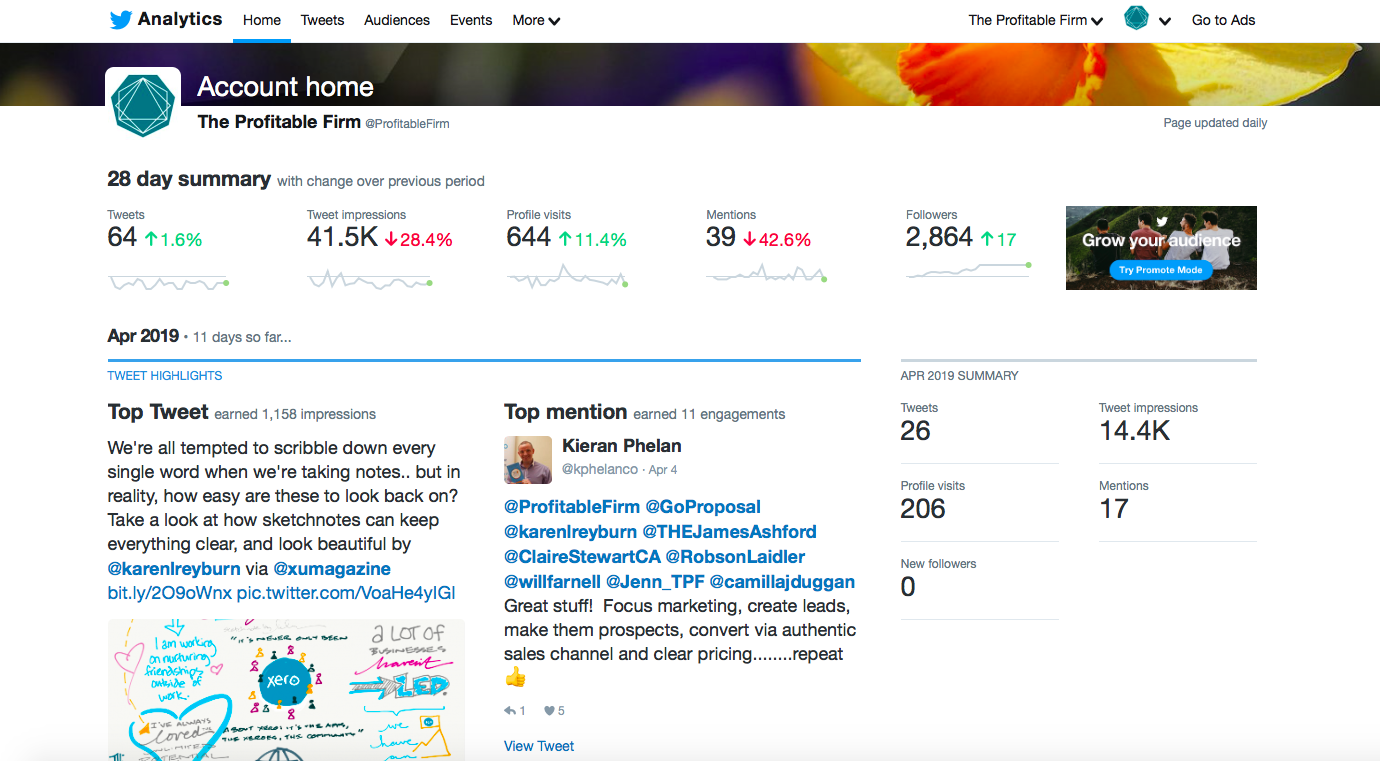
Tweets: This is the number of tweets you’ve posted for the past 28 days. By tracking this number, and looking at it along side your other stats you’ll start to see if there’s any relation between the volume of content you share, compared to the topic or type of content and the engagement.
Tweet Impressions: An impression is the total number of times a post has been delivered to another Twitter accounts timeline: this includes your followers, searches in which your post appears, and views by other people you may not be connected to (but someone you know has engaged with the post). This number can give you a good idea of your firm’s brand presence so it’s important to keep an eye on. We’ve a blog on this topic here.
Followers: This is the number of people that follow your firm’s profile on Twitter. Track this number monthly and you’ll start to see a rise the more activity you do.
Top Tweet: This is the tweet that’s had the highest impressions from the past 28 days. Keep in mind that this may not have the highest engagement so always look at the detail. I find this an interesting area to look at for a snapshot of what’s working between promotional and non-promotional content.
Retweets: This is the number of times your Tweets were retweeted by others within the past 28 days. This helps you see if your content is engaging, if you audience like it and see the value in sharing it with others. You can also delve into the number of times people ‘favourite’ your posts, reply, and click the links but we find the retweet stats are the most useful as a general overview.
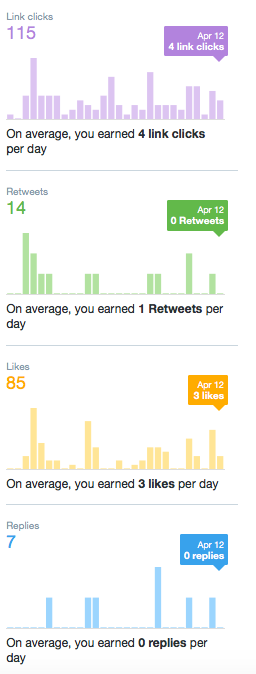
You can also dig into the stats of specific posts for more detail if you need to.
Facebook has a huge amount of data that you can dig into within your business page.
To view it all:
- Log into your Facebook account
- Go to your firm’s business page
- Look along the top row of options and click on ‘insights’
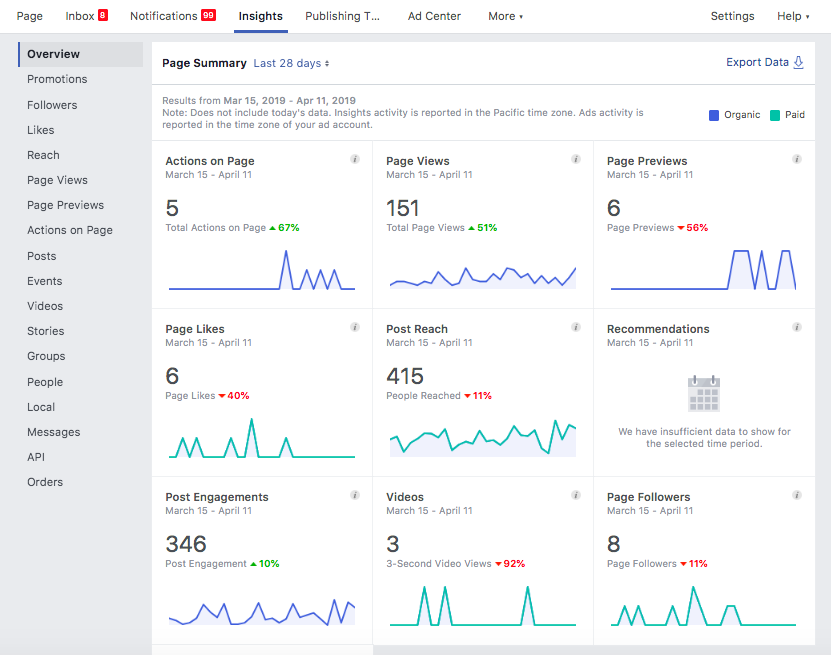
You’ll then see a lot of page options, as well as an overview page which can give you a summary of your activity from today, yesterday, 7 days or 28 days. I always choose the longest option to get a more accurate view of what’s happening.
Page likes: If you’re actively posting on Facebook and driving people to like your page take a look at this section on the overview page. You can track the number of new likes, which will show if people are interested enough in what you’re sharing to hear more.
Total likes: Click on the main ‘Likes’ tab and you can dig down into when you’ve had the most new likes, drop offs etc. You can then relate this back to what activity you’ve been doing throughout the month and tweak to improve, or keep going as you are if you’re happy with the growth.
Engagement: This gives you insight into the total number of unique people who have liked, commented, shared or clicked your posts during the time period you want to review. You can view this per post too, so again this is helpful to see what content is pushing people to engage.
Organic v paid: Within almost all of the sections you can click to view either organic results, or paid results.
Facebook lets you download your data: useful if you want to create your own report!
To view all your Insta stats you need a business account for your firm. Then you’ll be able to see an overview of your posts’ performance and demographics like gender, age and location of your followers.
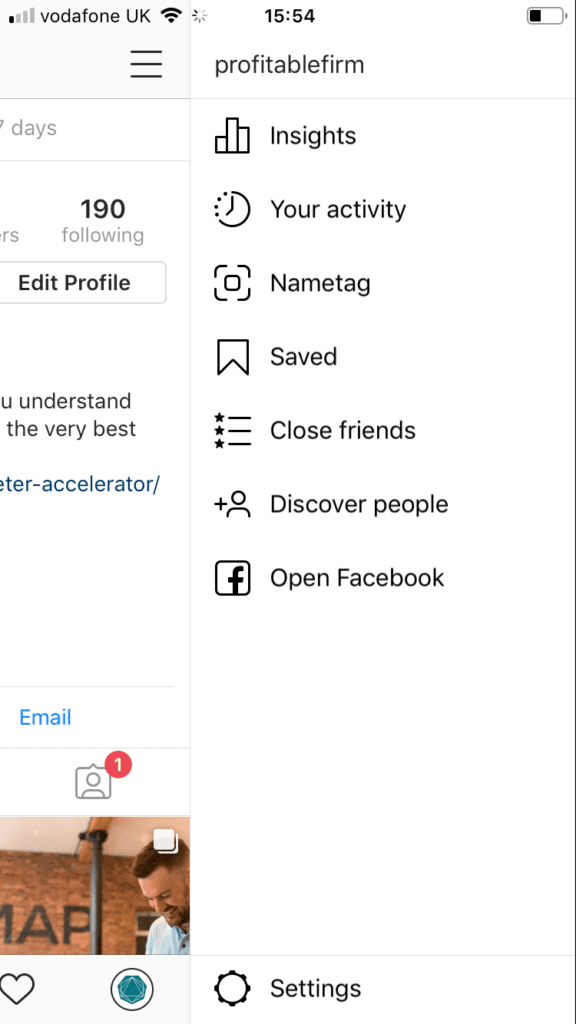
To view insights from your business profile:
- Log into your Insta
- Go to your business profile
- Click the 3 lines icon
- Click Insights
- Choose which posts you’d like to view
The most important things to track here are:
Number of followers: Each month keep note of the number of followers you have and you’ll start to see if you’re growing, or not. You can view these on your profile without going into the analytics area.
Impressions: A lot of people just browse Instagram, taking in what they see rather than commenting. That makes the impressions number important as you’ll get an idea of the size of potential audience you have when you’re sharing content. To view the stats just click on your posts.
Top posts section: Insta gives you a run down of your best performing posts which you can sort by metrics like date, engagement, reach, video, photo. Again this can reassure you you’re on the right content path or give you the opportunity to tweak what you’re posting.
You can view direct analytics from your firm’s LinkedIn account too.
Here’s how to access the analytics area:
- Log into your LinkedIn profile
- Move to the ‘Me’ tab and scroll down to click your company profile.
- Then click ‘Analytics’.
That’s it. All your stats are in here for your company profile activity.
Followers: This will show if your building an audience through your activity. Keep tracking this number monthly if you’re focusing on sharing content on LinkedIn. You’ll find this number on your ‘followers’ tab under ‘analytics’. It also give you the location breakdown of all your followers.
This can be helpful if you want to share content for a specific region e.g an event where you’re sharing a Xero update for businesses in Edinburgh.
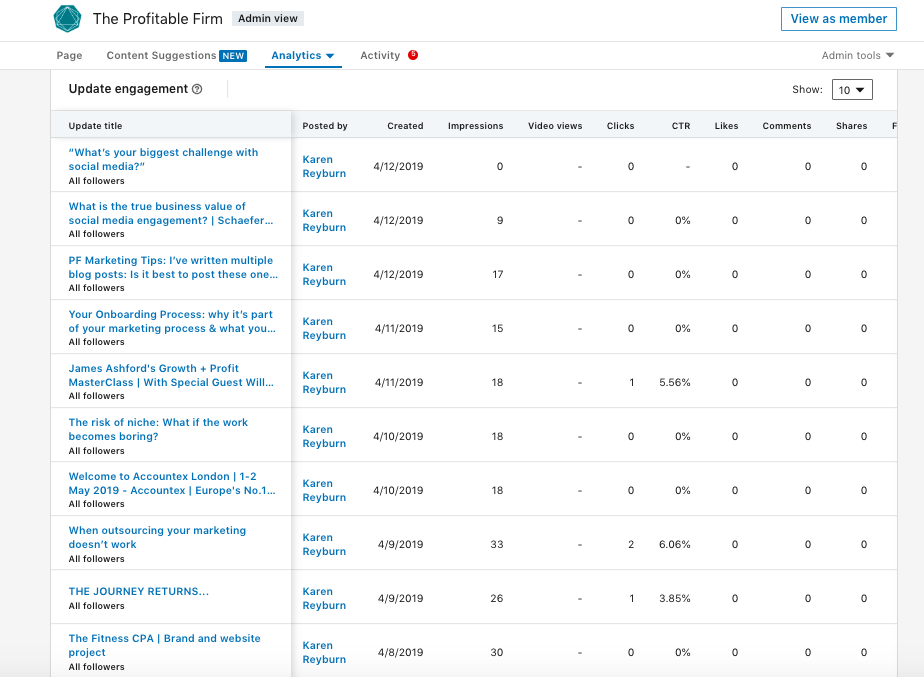
Interactions: Under the ‘updated’ tab you’ll get all the info on the number of likes, comments and shares from the past month. You can also dig into each post to see what worked, and didn’t.
Where do I save all these numbers I want to track?
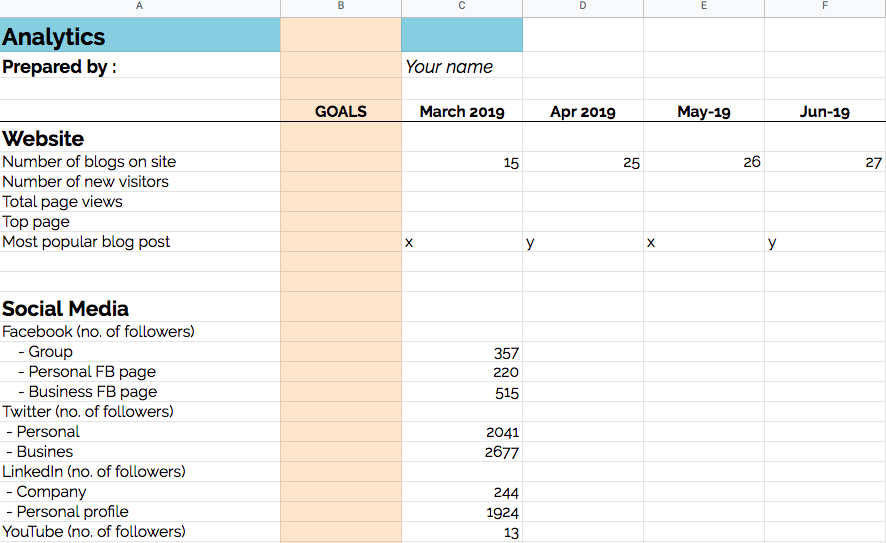
The key to consistently tracking on a regular basis is keeping it simple.
Create a GSheet and list your platforms, and the key metrics you’re going to track each month down in a column, then the months across the top. You can always add more once you’ve got to grips with it.
Then as you have each analytic tool open, look for the stat you need and pop it in your GSheet.
If you’re an Accelerator member, this template is included in your membership. Just ask us for yours.
How do I use all the info to figure out what’s working, or not?
You’ll start to see your progress after a few months. All marketing activity is so integrated that you need to look at these numbers alongside the rest of your activity: look for patterns, rather than at a stand alone number.
For example: A common (and useful) goal is to grow your audience (with your target market) to build trust through the content you share, and in time when these people need help they’ll come to you. So you must know the number of followers you have at the start, then each month you’ll be able to see your progress. There’s a lot of things that can help increase your followers: have a think how these people are finding you. Look at the number of blogs you’ve written and shared each month. Have you attended any events and posted some social? Or sent a newsletter out and shared your social media links?
Is there a jump in new followers around the same time as any of the wider activity? Your numbers against each month are going to build this picture for you.
If on the other hand your audience isn’t growing as you expected, you’ll be able to decide what activity to increase e.g more blog posts, or change: but all based on the knowledge of what you’re already doing. It also gives you the chance to test our different things.
You can then go deeper and have the conversations with your team around why certain things might be happening: for example why one blog post is doing much better than another.
To stay on top of it all set a date in your calendar each month to review the analytics and stick to it.
To understand the benefits of daily social media posting, and how you can use that to build trust with your potential clients, take a look at the free Social Marketer videos.